Accounts of a microbial hunter in France
Sharpening my knowledge on the “tools” used to “hunt” for microbes involved in water treatment

I wonder if we’ll have any luck finding our microbial counterparts in Aix en Provence, France.
In the previous post for this series, I discussed how my first week at the Centre National de la Recherche Scientifique (CNRS) involved creating research questions. These questions would serve as a “map” to search for microbes involved in treating nitrate contaminated water. Formulating these research questions at the beginning assisted with developing a plan and selecting essential research components. This blog post is a recount of the weeks that followed and highlights activities that I was engaged in. It also includes a reflection of those early weeks based on my current mindset (week 11 to be specific) and the experiences that I have collected thus far. I would like to direct anyone who is just joining the series to the first blog post, which serves as an introduction. Information on the motivation, application, and a brief background of the biological treatment method we are harnessing (i.e., denitrification) is provided. The link to this post can be accessed here. Thank you for taking the time to join me on this journey. Buckle up and lets begin the ride!
Prelude:

The research questions formulated for this investigation assisted with the selection of samples and controls to examine the microbial composition in engineered systems aimed to biologically treat nitrate contaminated water in small communities.
The questions formulated for our research activities at CNRS assisted with selecting samples and the appropriate controls. The experimental samples for this investigation originated from engineered systems containing sulfur-bearing minerals. These systems were created in efforts to evaluate their performance in treating nitrate contaminated drinking water.
Once these samples were selected, they were sent to a company to undergo next generation sequencing (NGS). NGS is a method used to determine the DNA sequences of organisms (in this case microbes) within the samples provided. The resulting output of this process is big data representing the organisms within the samples. Biological and computational tools (i.e., bioinformatic tools) are applied to process and analyze the big data to identify the microbes in these engineered systems.
“Biological and computational tools (i.e., bioinformatic tools) are applied to process and analyze the big data to identify the microbes in these engineered systems.”

Galaxy is a free online application that researchers can use to process and analyze next generation sequencing (NGS) big data.
The Galaxy application is the tool of choice to hunt for our microbial counterparts

The Galaxy application offers free online resources for learning how to perform a variety of analyses through their training network.
Galaxy is a bioinformatic tool that can be employed to examine NGS sequencing data. It is a free open-source and web-based application that allows for the processing and analysis of big data using many common tools. The goal of this tool is to develop and maintain a system that enables researchers without informatics expertise to perform computational analysis. There are three Galaxy websites (Galaxy, Galaxy Europe, and Galaxy Australia) and the primary difference between them is where their servers are located. These websites contain similar tools and researchers across the globe can choose which to use based on their needs. While the samples were undergoing NGS, I began learning key tasks of the Galaxy platforms to prepare for subsequent processing and analysis of the NGS big data. This was achieved by taking advantage of the the free resources that are available through the Galaxy Training Network.
Let the training begin!! - Building fundamental skills using the Galaxy application

I began my journey by using the Galaxy application’s free tutorials.
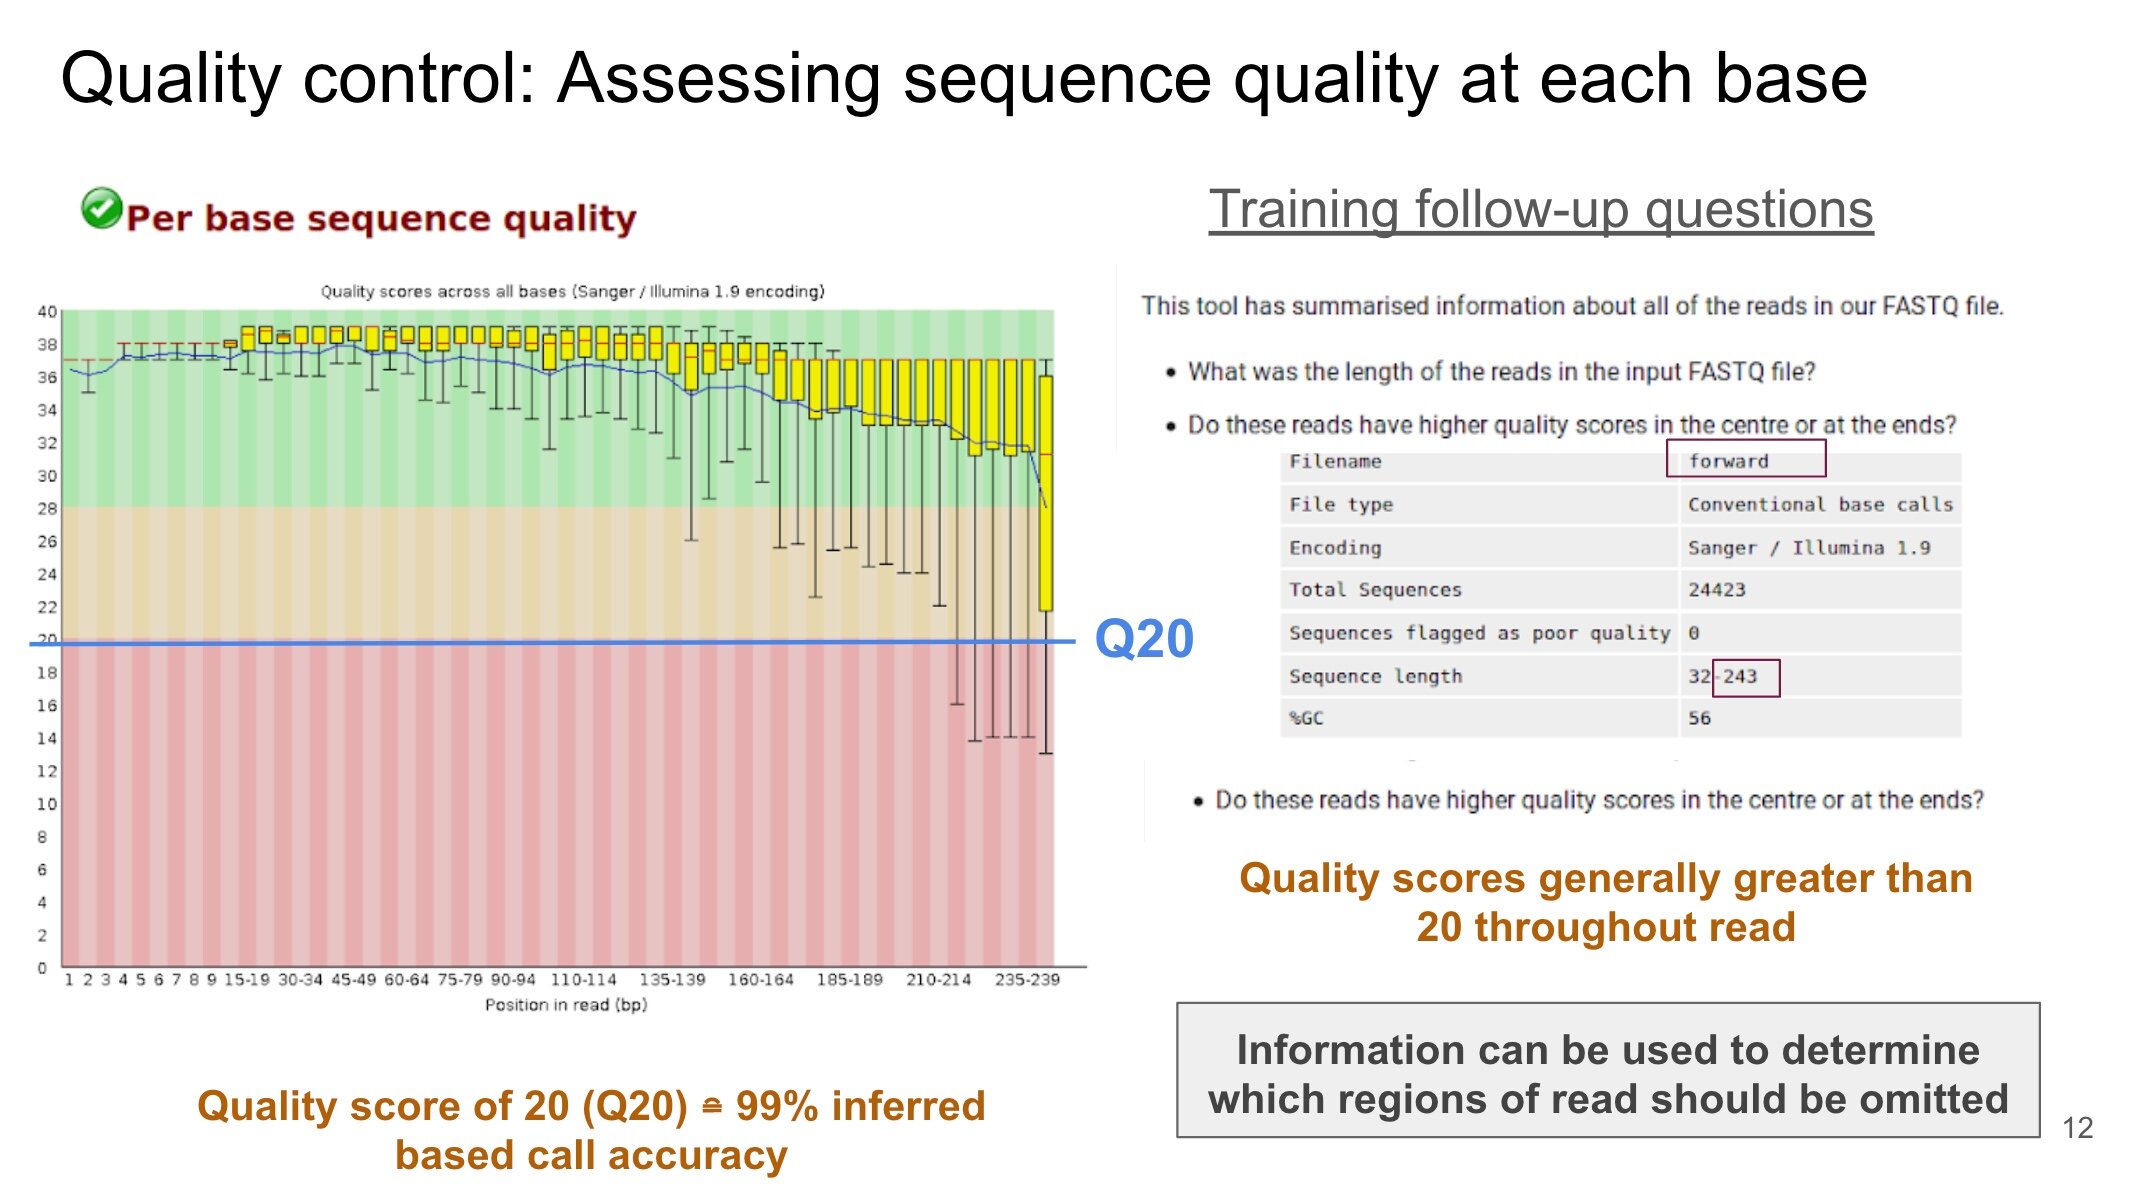
My training journey with Galaxy began with learning how to perform basic tasks using the following link as a guide. This involved creating a “history,” which represents a record of a task or series of tasks. During this exercise, I learned how to upload data onto the Galaxy application and determine whether it was in the appropriate format for subsequent analysis. This exercise also provided instruction on performing an initial quality assessment of the big data using the FastQC tool. This tool is helpful in determining an appropriate quality score to assign in efforts to remove low quality NGS data.

The Galaxy Training Network provides a hands-on tutorial for analyzing NGS sequencing data to identify microorganisms within samples.
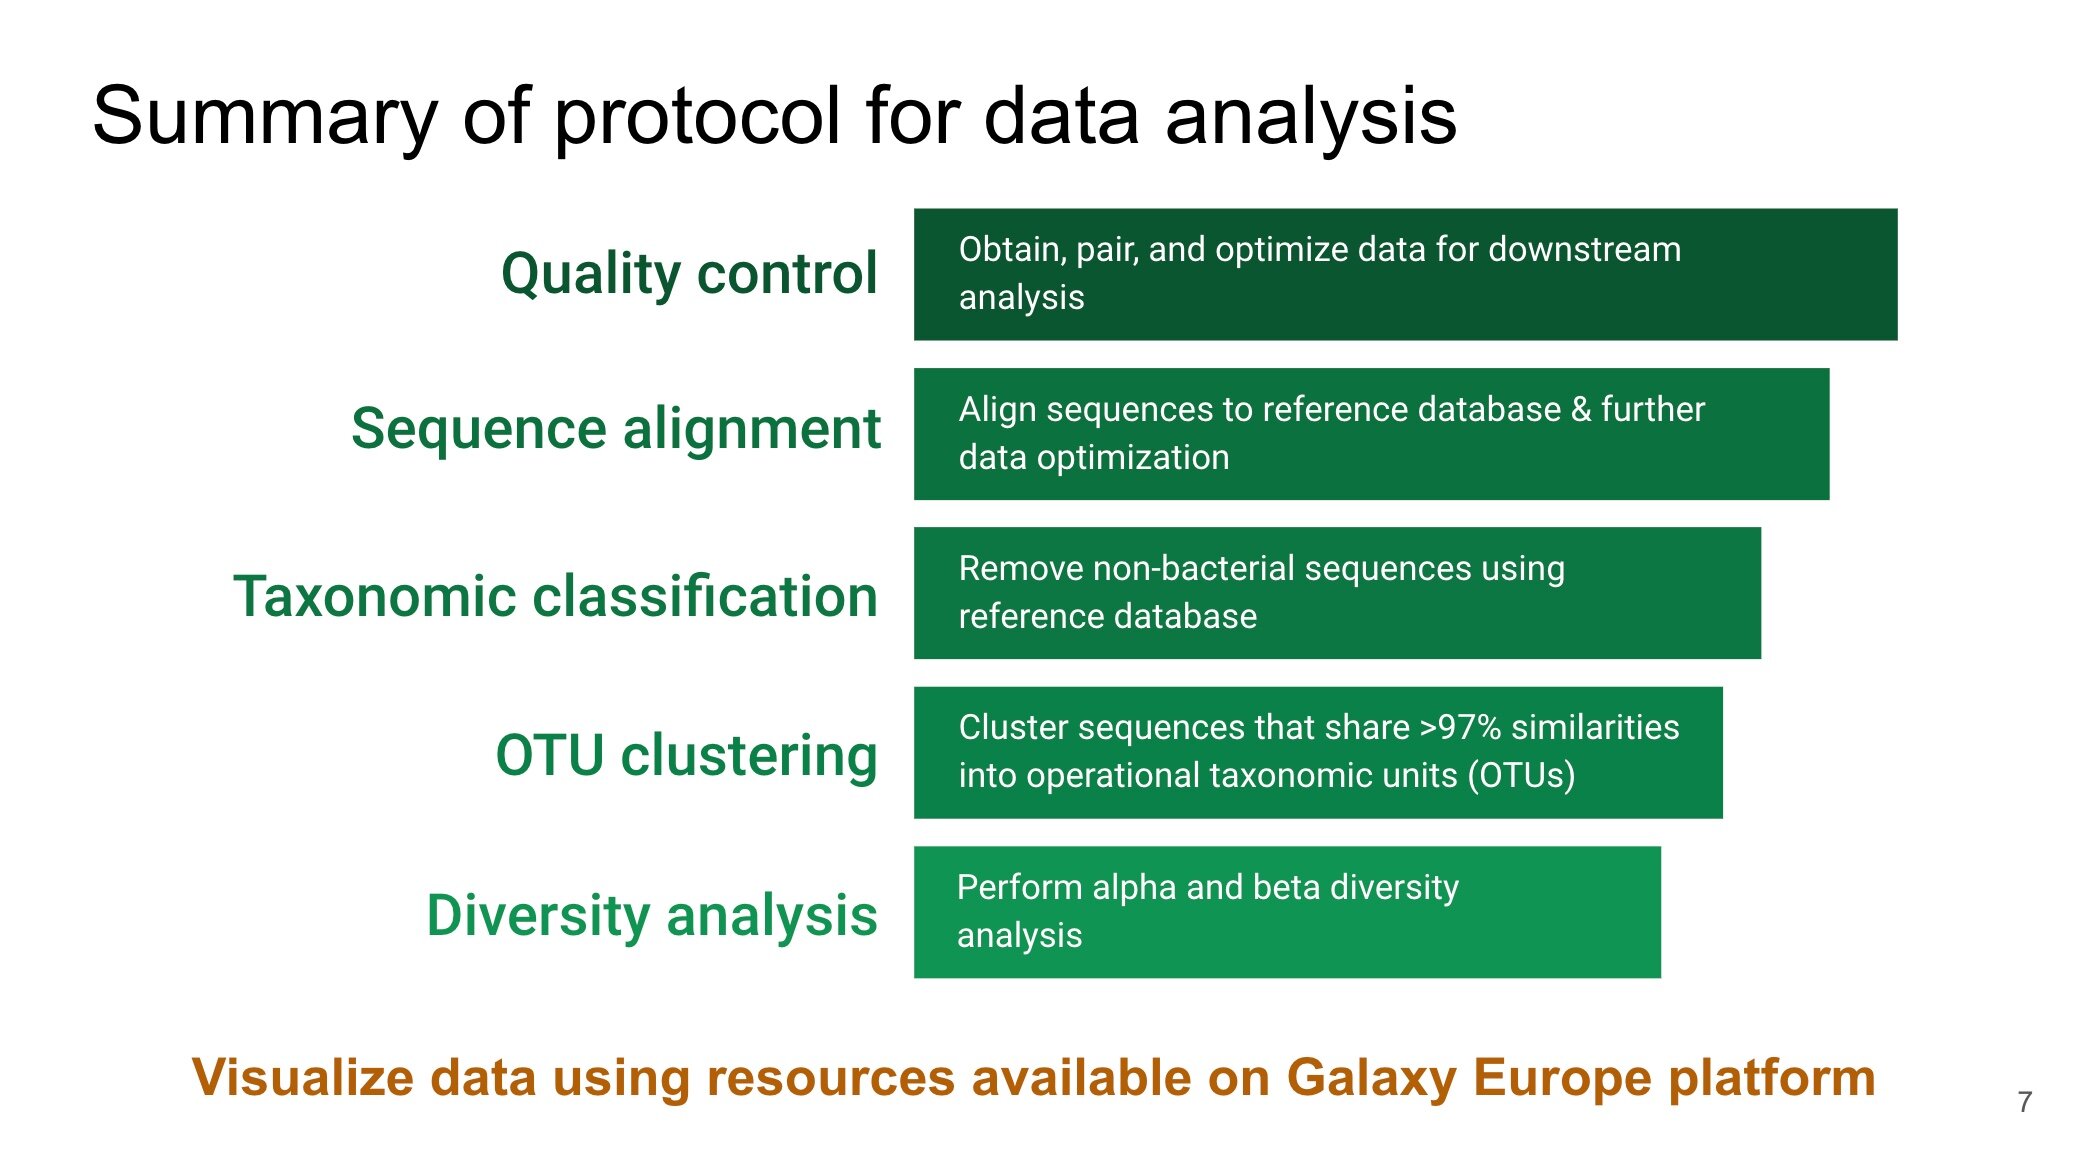
After completing this exercise, I began the 16S Microbial Analysis with Mothur. 16S is a gene that is typically used to identify microorganisms in a sample. Furthermore, Mothur is a software that provides tools for processing and analyzing NGS big data. The Galaxy platforms incorporates tools from Mothur. As a result, this prevents the need to input specific programming commands to use the Mothur tools. Thus, Galaxy users need only to provide their data and input desired parameters for the tools selected. Analysis of NGS big data in Galaxy is a much simplified process!

Various visualization tools in Galaxy can be used to represent the big data remaining after the analysis. This bar chart was created using data provided by the Galaxy 16S tutorial. This diagram provides information on the types of gut-bacteria and their abundance in mice over the course of several days.
The 16S Microbial Analysis tutorial provides data for experiments that were carried out in real-life. Questions are also included to remain engaged throughout the activity and to check your progress. At the end of the analysis, I was able to practice visualizing the data that I obtained in a series of diagrams (e.g., rarefaction curves, venn diagrams, heatgraphs, and bar charts). These diagrams serve as visual aids to provide information on the alpha diversity (diversity within a sample) and beta diversity (diversity between samples). The diagrams assisted in taking complex information represented in the big data from the analysis and portraying it in a clear and concise manner that communicates the “take home message.”
Feel free to visit my twitter page, which features additional comments about my experience with using the Galaxy Training Network.
Reflection: I experienced a “learning curve” earlier rather than later & refined knowledge and skills in the process

Above is a photograph of the notes that I took from the 16S Microbial Analysis tutorial. These notes have served as a valuable resource for processing and analyzing the NGS big data.
My early beginnings of using the Galaxy Training Network (especially the 16S Microbial Analysis tutorial) was quite a learning curve. As an undergraduate and master’s student, I studied biological sciences and acquired a basic understanding of NGS and bioinformatic tools. However, I had no previous experiences with analyzing NGS big data before arriving at CNRS and was unsure of what to expect. My knowledge gradually increased with guidance from my mentor (Dr. Emmanuel Talla) and the 16S Microbial Analysis tutorial.
At the beginning of my experience at CNRS, Dr. Talla provided me with papers to use as a resource. These papers provided information to gain a better understanding of how microbial communities can be studied. One paper that I found quite helpful was Hugerth et al., 2017. This document contains a comprehensive description of how microbes can be analyzed - from when the samples are collected to visualize the big data. This paper was valuable for me because it clarified questions that I had and filled knowledge gaps that existed.
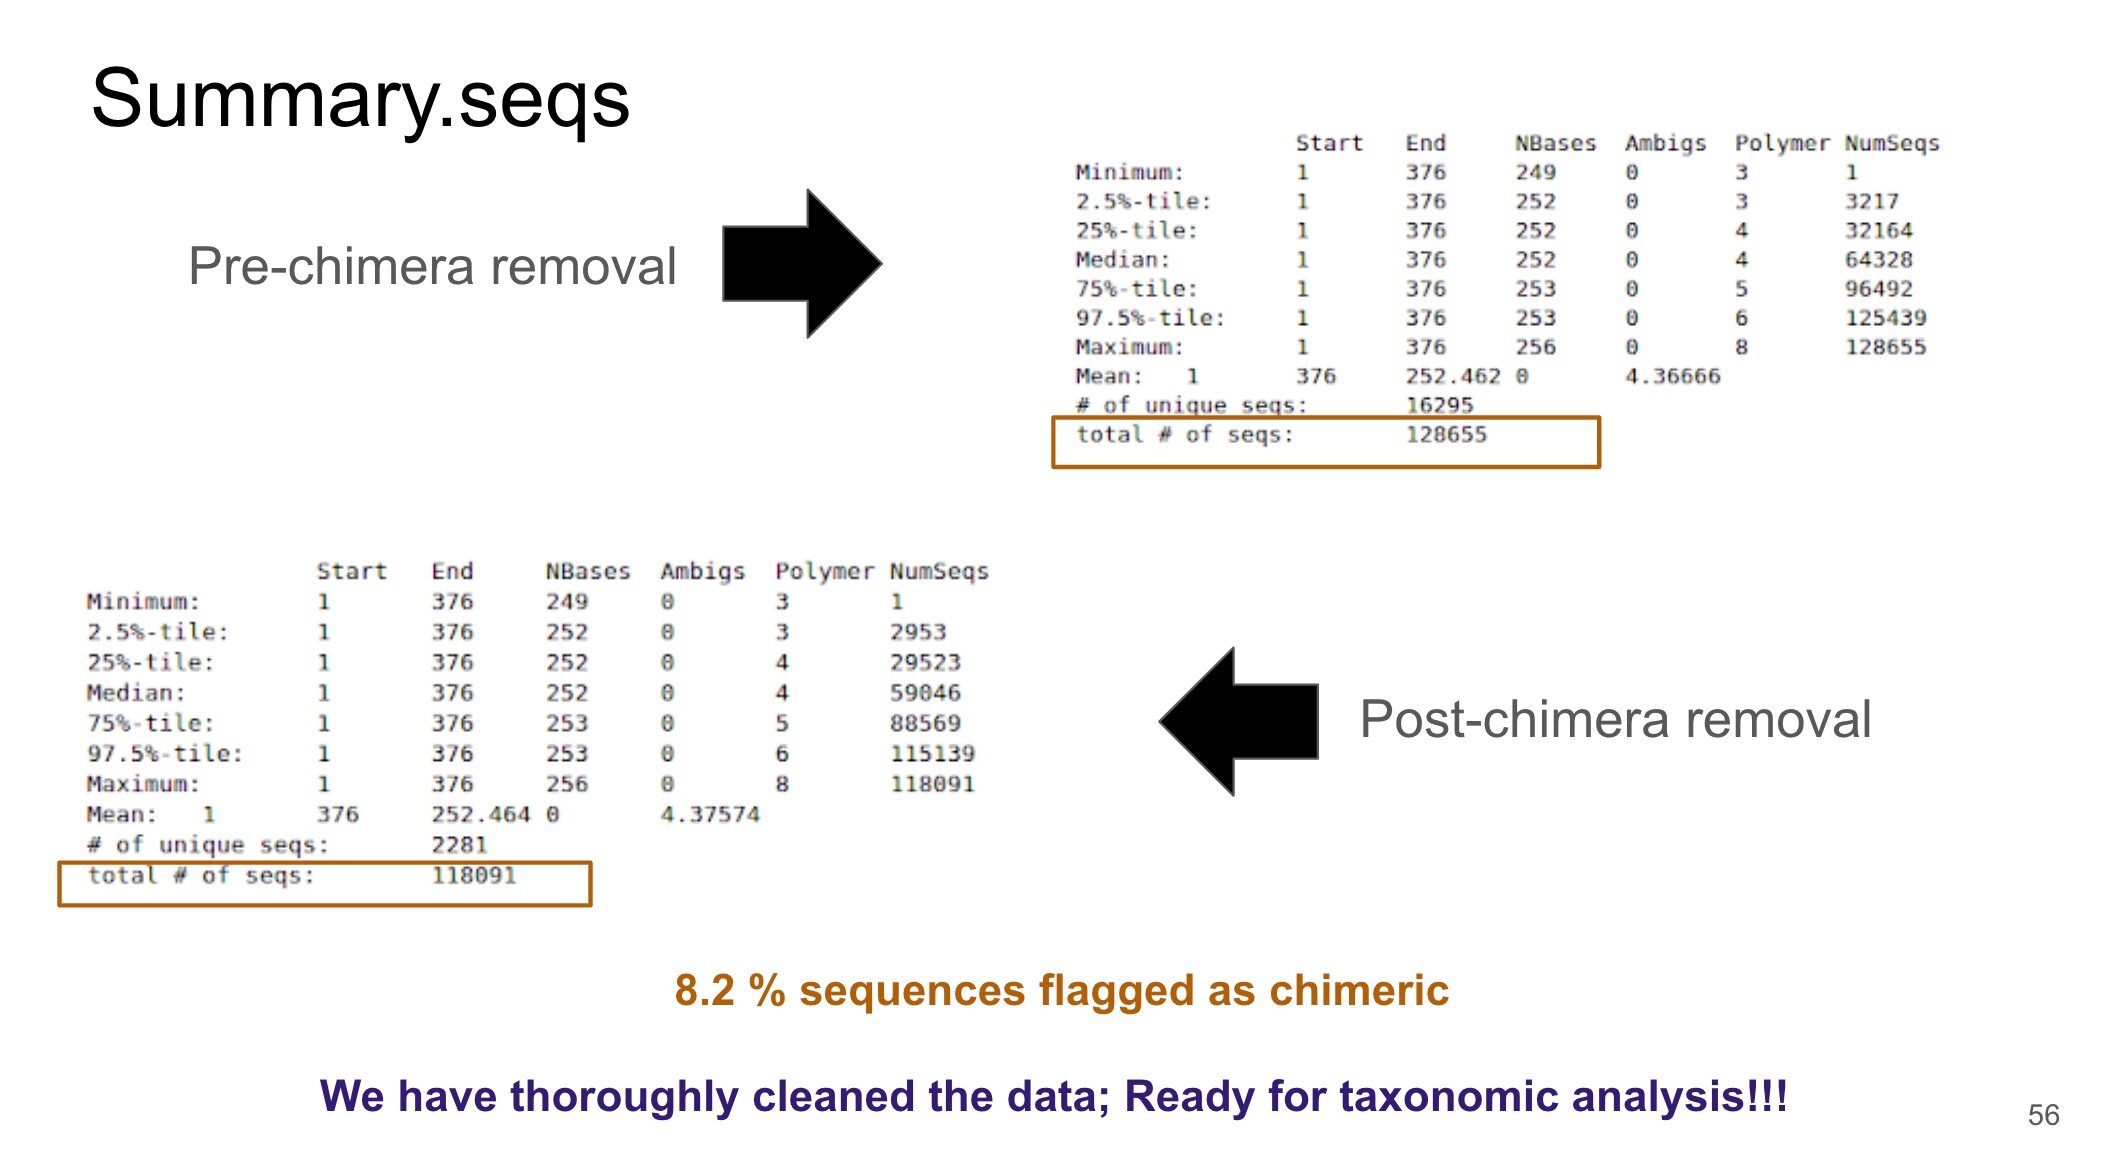
During the 16S Microbial Analysis tutorial, I took meticulous notes to ensure that I understood each step of the analysis and why certain tools were used. These notes where helpful in the beginning, especially when I was trying to interpret the data as it was processed and answer questions within the tutorial. For instance, during the analysis there is a step that requires the removal of data known as chimeras. Chimeras are sequences that have combined (i.e., hybridized) during the NGS process and can lead to data artifacts. Thus, it is important to remove these elements during the processing steps to ensure that a proper analysis of the big data is performed. Reviewing the notes that I had taken on the tutorial has helped me in gaining a better understanding of this concept of chimeras and how to remove them. I have also been able to communicate this topic clearly to my major advisor (whose discipline is outside of bioinformatics; environmental engineering to be specific) occasionally during our weekly meetings.
A practice that I found helpful in remaining organized and interpreting the data is creating slides that highlight the various stages of the processing and analysis steps. I used this practice to answer the 16S Microbial Analysis tutorial questions and track my progress. In addition, these slides have been helpful during my current examination of the NGS big data. I have referred to these slides on numerous occasions to interpret the visualization charts generated from the analysis. Furthermore, I have made additional use of these slides during my weekly remote meetings with my major advisor!
Acknowledgements
I would like to thank the Chateaubriand Fellowship, Alfred P. Sloan Foundation, and McKnight Doctoral Fellowship for supporting this project and encouraging opportunities for graduate students to pursue research abroad!
Thank you for your time and I hope that you were able to learn something new from this post. For any additional questions or comments feel free to leave your responses below!